PlayStudio
The creator console for SharePlay: channel stats, stream performance, plays, chat tools and earnings in one dashboard, with Louie on hand to explain any number.
- Client
- SharePlay
- Team
- Product design, UI and the design system
- Timeline
- 2026
- Status
- Live
Challenge
Creators need answers, not just numbers. Streaming data arrives as raw counts. A creator wants to know what changed, why, and what to try next, without leaving the studio.
Approach
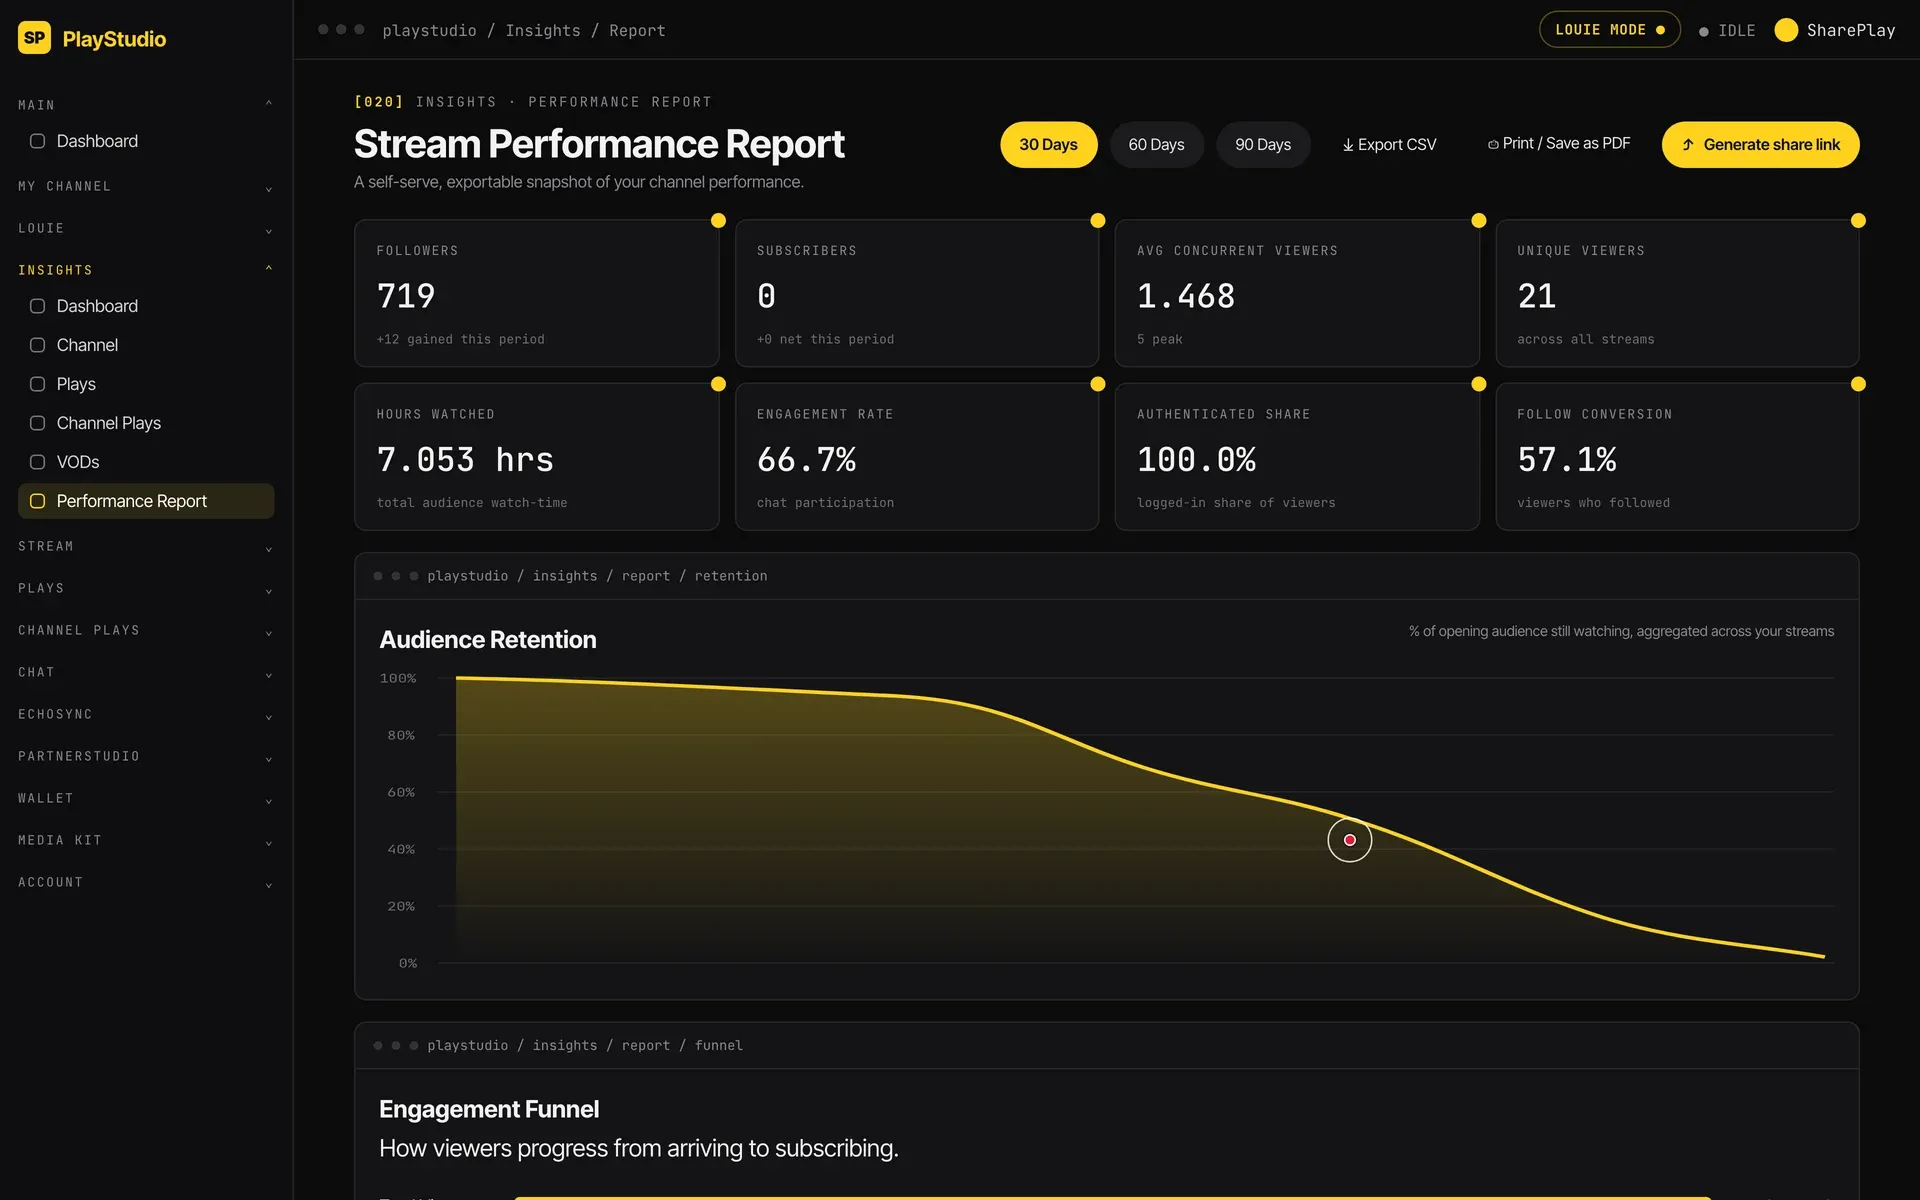
One sidebar for the whole channel: Main, Insights, Stream, Plays, Chat, Wallet and Media Kit, so every tool sits one level deep. The Stream Performance Report puts followers, retention and the engagement funnel on one page with 30, 60 and 90 day ranges, CSV, PDF and a share link. In Louie mode every stat carries a marker that Louie explains in plain words.
01 Louie mode
Ask about any metric.
In Louie mode each stat carries a marker. Select it and Louie explains the number in plain words, beside the chart it came from.
02 Insights
A report a creator can share.
Followers, retention and the engagement funnel on one page, with 30, 60 and 90 day ranges, CSV, PDF and a share link.
Outcome
Live for SharePlay creators at playstudio.shareplay.tv, signed in through their SharePlay account. Explaining a number earns more trust than adding another chart.